Holy IeltsTheo đuổi mục tiêu của bạn tới cùng

Menu

  • Trang tổng quan
  • Chấm Writing
  • Chấm Speaking
    • Đề Writing
    • Đề Speaking
    • Đề ReadingMới ra mắt
    • Đề ListeningMới ra mắt
  • Lịch sử làm bài
Nâng cấp PremiumMở khoá chấm không giới hạnĐăng nhập
  • Trang tổng quan
  • Chấm Writing
  • Chấm Speaking
  • Thư viện đề thi
Messenger

Thư viện đề Writing

Chọn đề theo chủ đề, độ khó và bắt đầu luyện tập như thi thật.

Từ khoá
Phần thi
Dạng câu hỏi
Trạng thái
Task 1Map

Class size in Australia

The map below shows the size of classes in primary (elementary) schools in four states in Australia in 2010. Summarise the information by selecting and reporting the main features and make comparisons where relevant.

3.092 lượt làm20 phút
Task 1Map

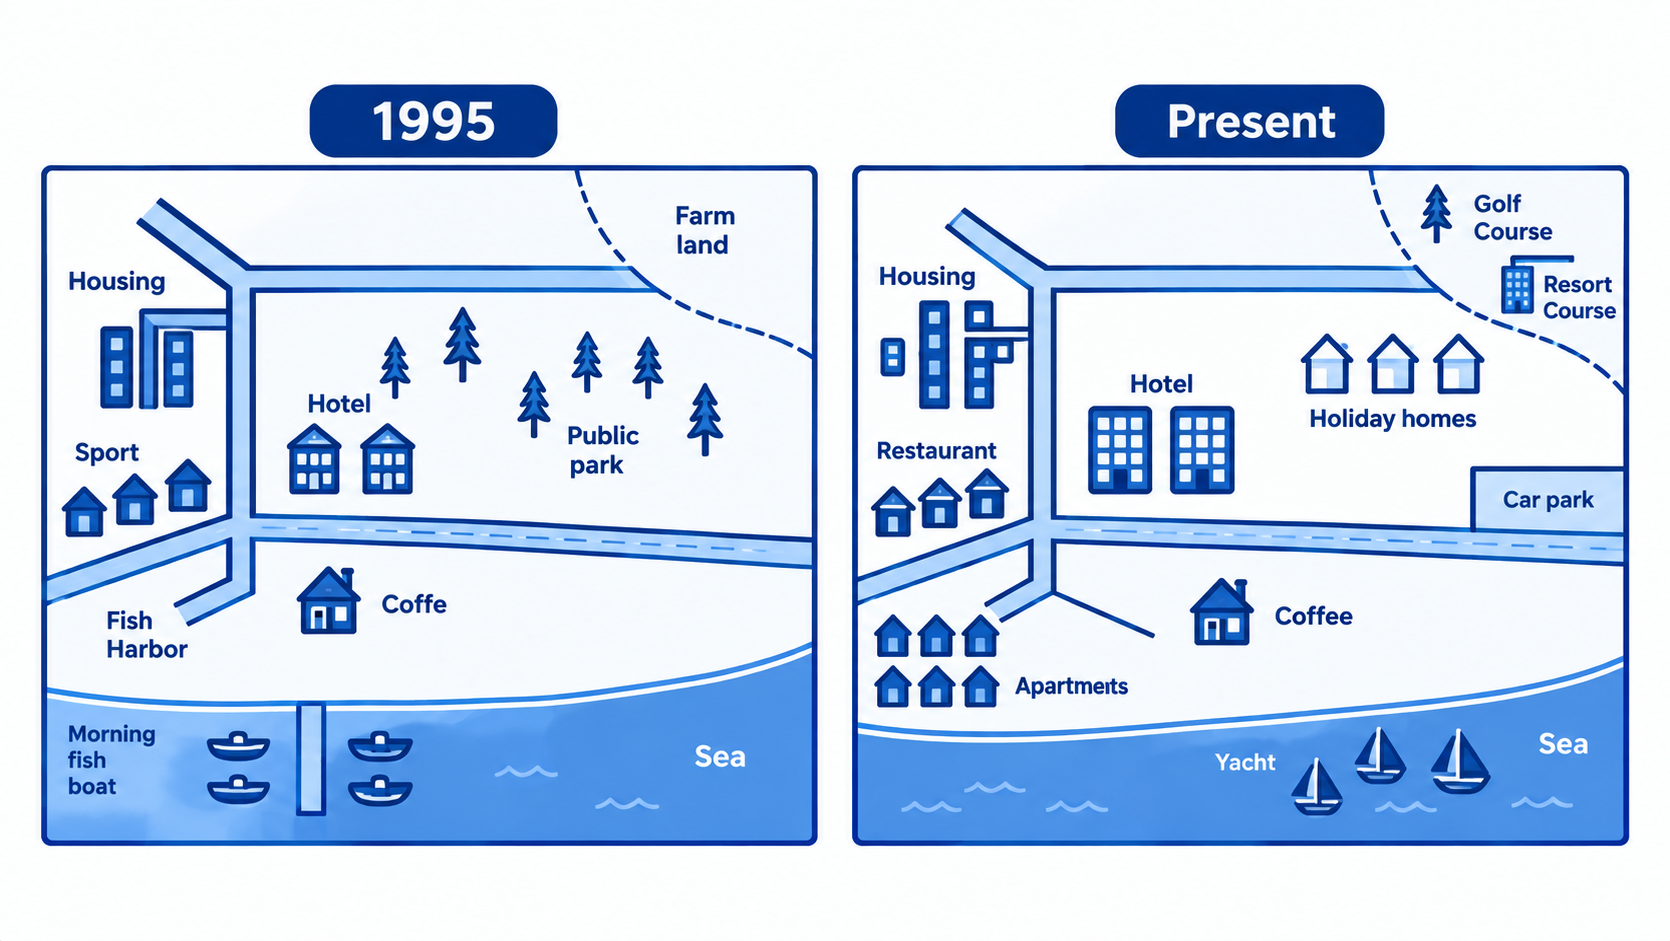
Ryemouth village development

The maps above show the development of the village of Ryemouth between 1995 and present.

6.789 lượt làm20 phút
Task 1Map

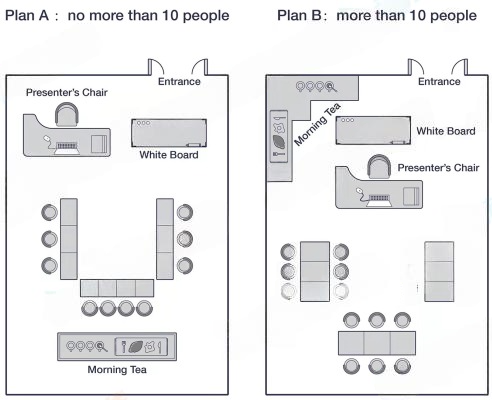
Room for Training Sessions

The plans show the room layouts for training session for up to ten people and more than ten people. Summarize the information by selecting and reporting the main features, and make comparisons where relevant.

9.177 lượt làm20 phút
Task 1Process diagram

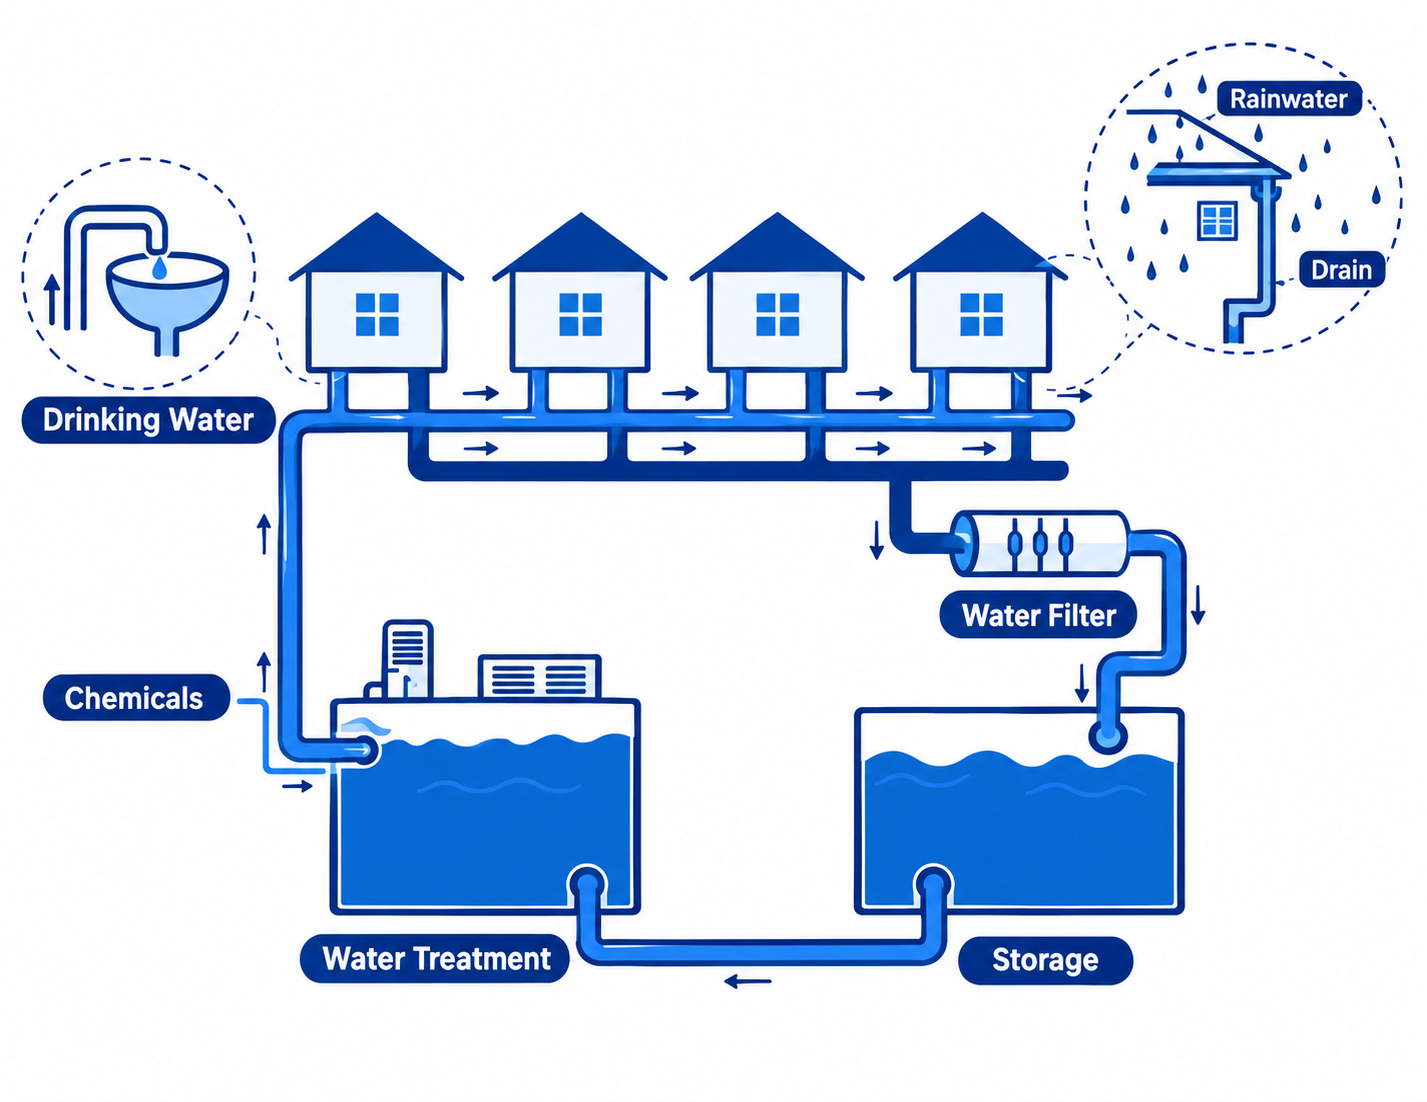
Rainwater collection process in Australia

The diagram shows how rainwater is collected for the use of drinking water in an Australian town. Summarize the information by describing the main features of the charts and making comparisons where appropriate.

5.094 lượt làm20 phút
Task 1Process diagram

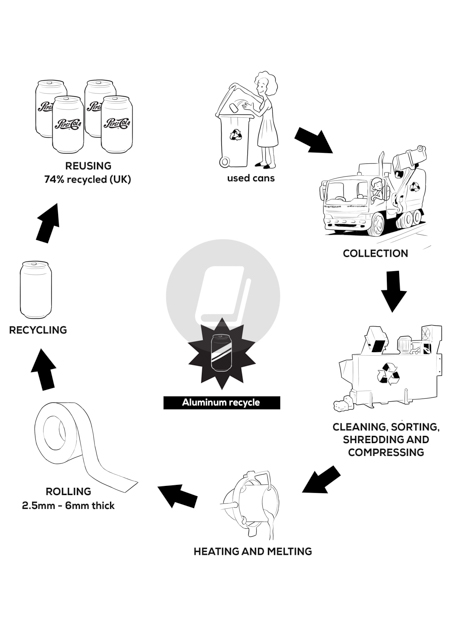
Aluminium can recycling process

The diagram below shows the recycling process of aluminium cans. Summarize the information by describing the main features of the charts and making comparisons where appropriate.

8.242 lượt làm20 phút
Task 1Process diagram

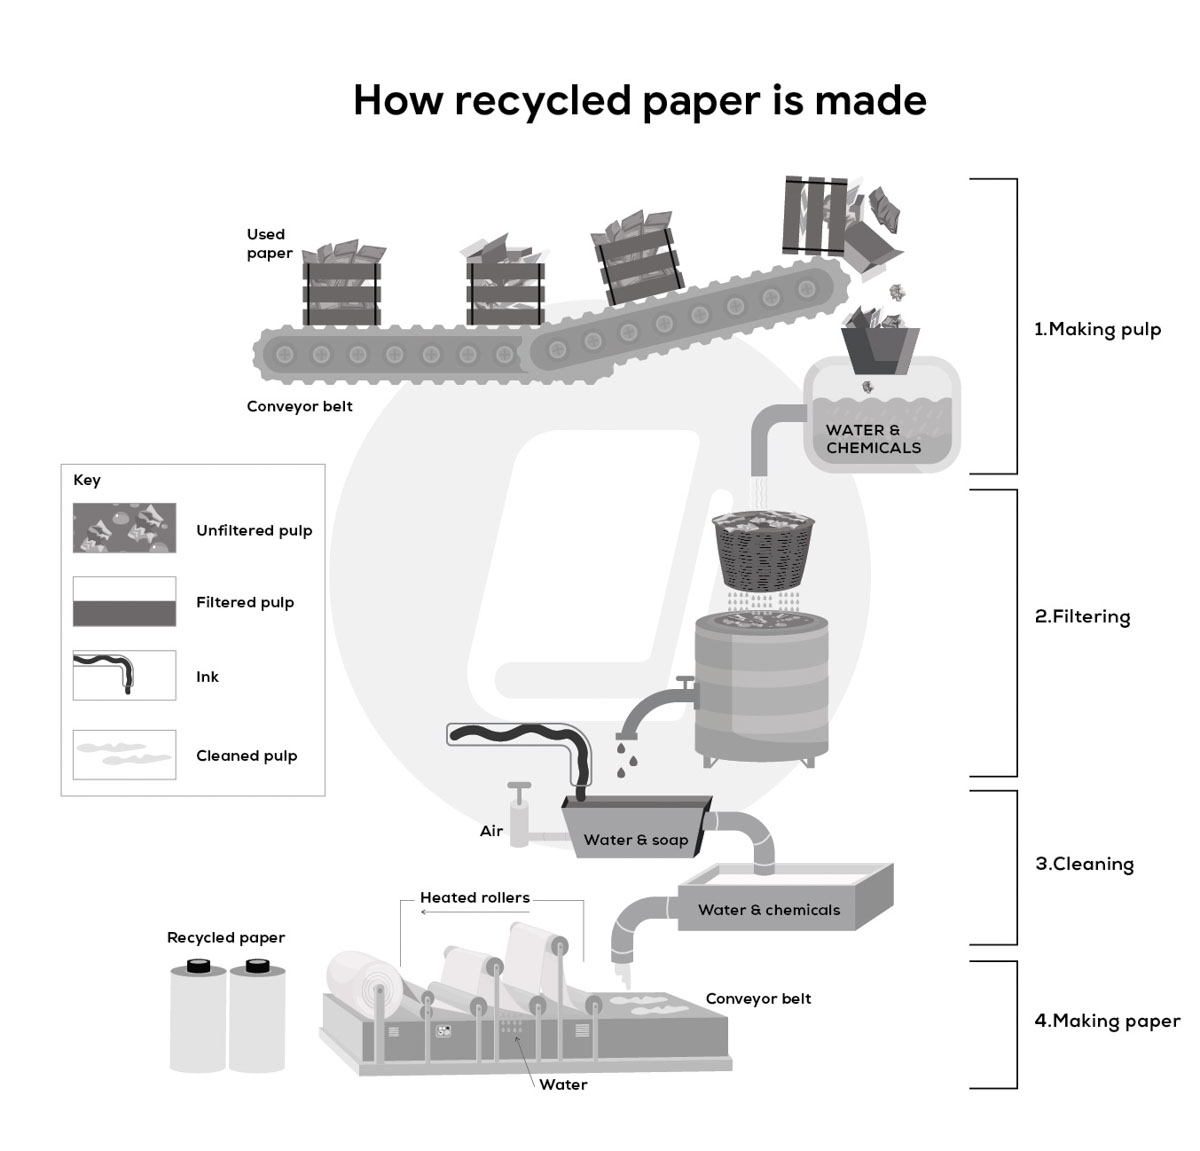
Paper recycling process

The diagram illustrates how recycled paper is made. Summarize the information by describing the main features of the charts and making comparisons where appropriate.

7.647 lượt làm20 phút
Task 1Mixed charts

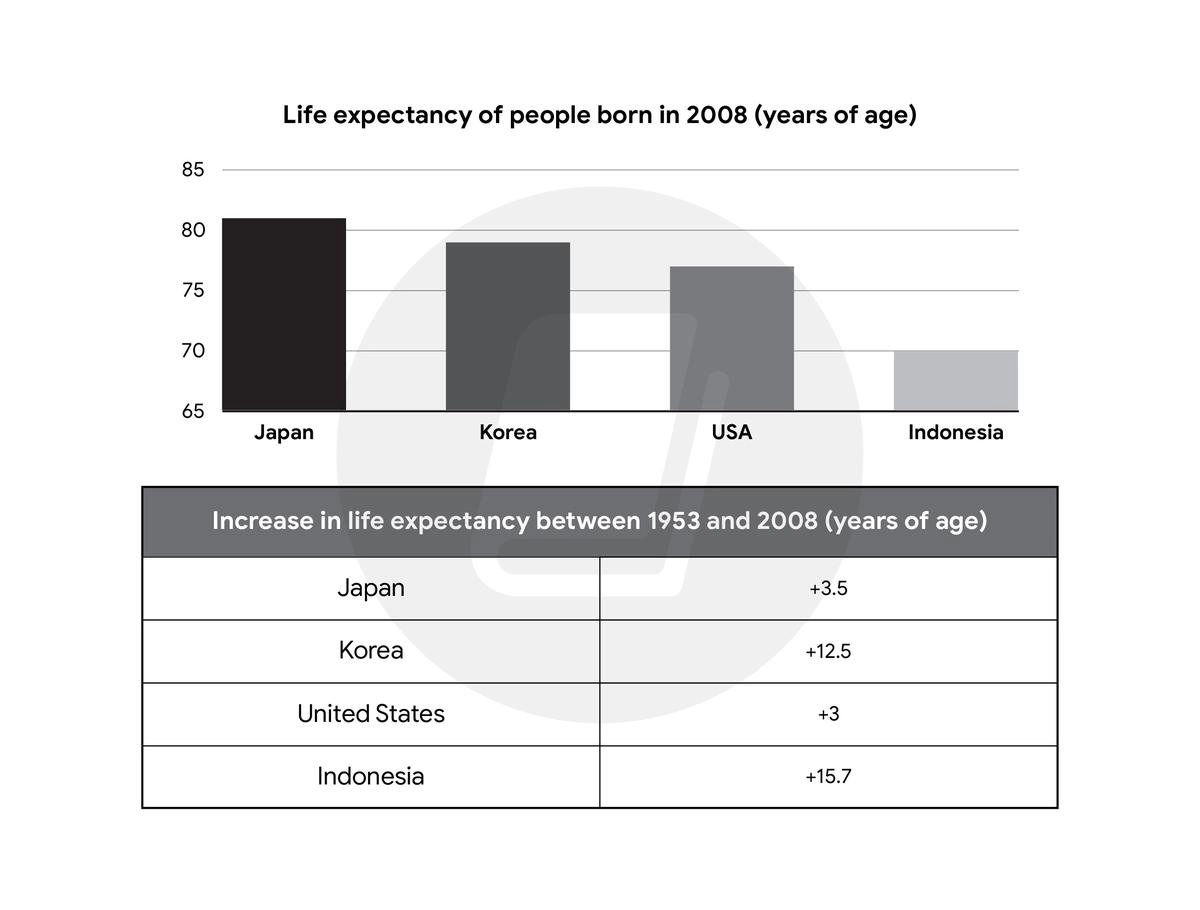
Life expectancy trends

The bar chart gives information about the life expectancy in Japan, Korea, the United States, and Indonesia, and the table shows the change in life expectancy between 1953 and 2008.

9.459 lượt làm20 phút
Task 1Mixed charts

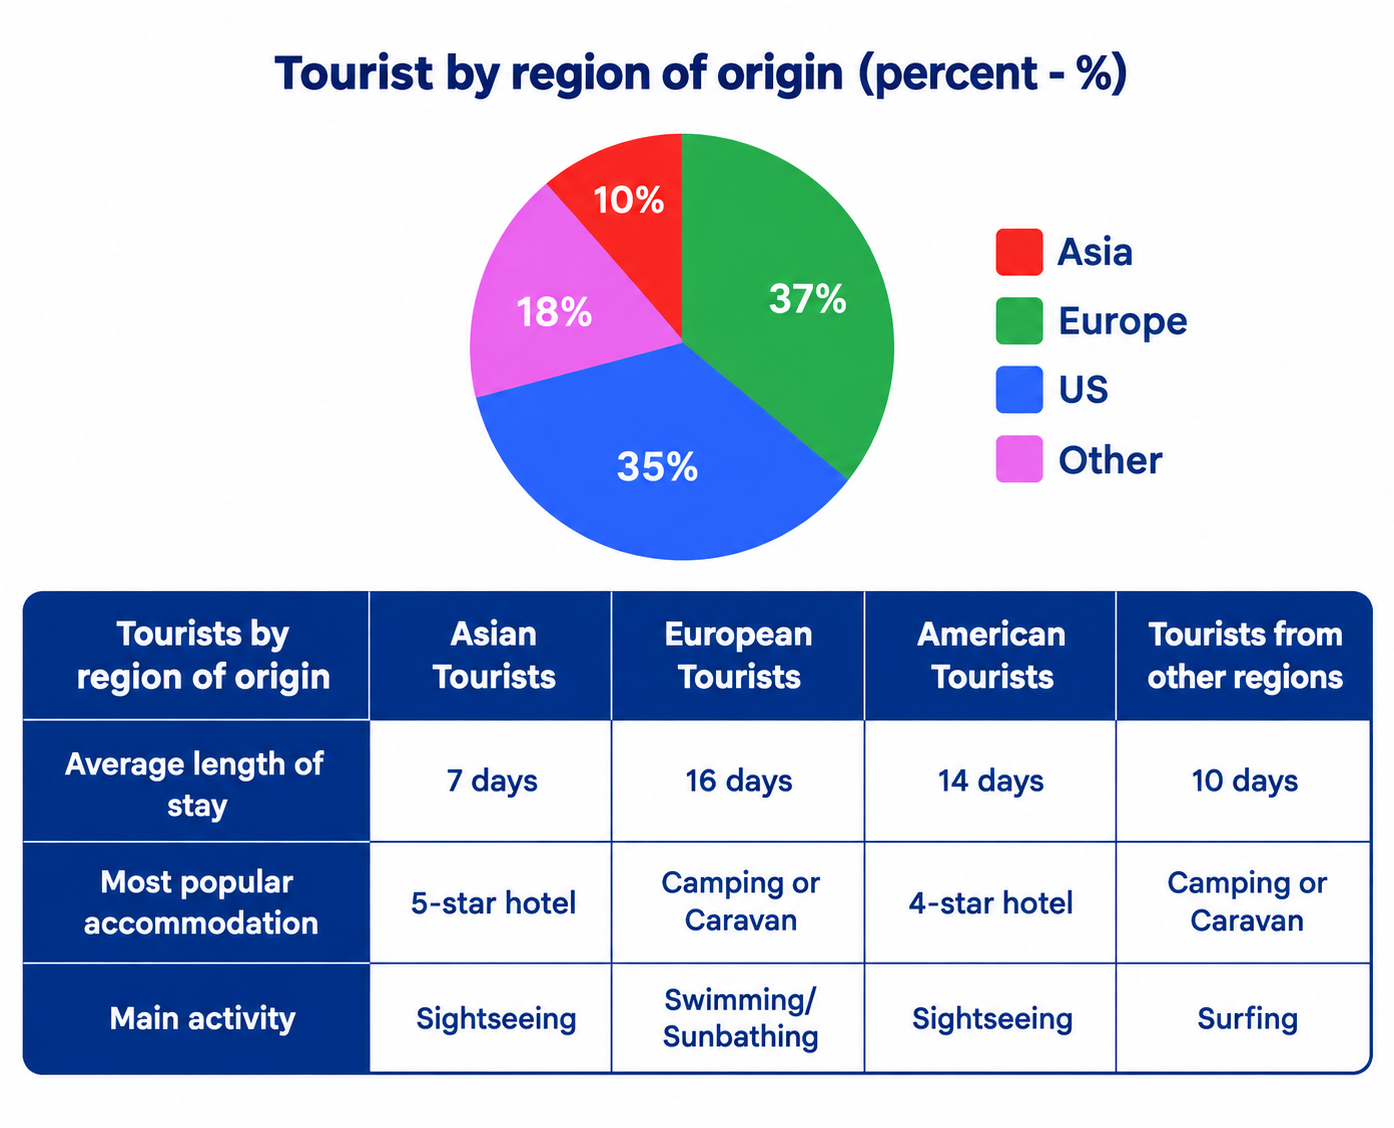
Tourist data Australia

The chart and table below give information about tourists at a particular holiday resort in Australia.

9.538 lượt làm20 phút
Task 1Mixed charts

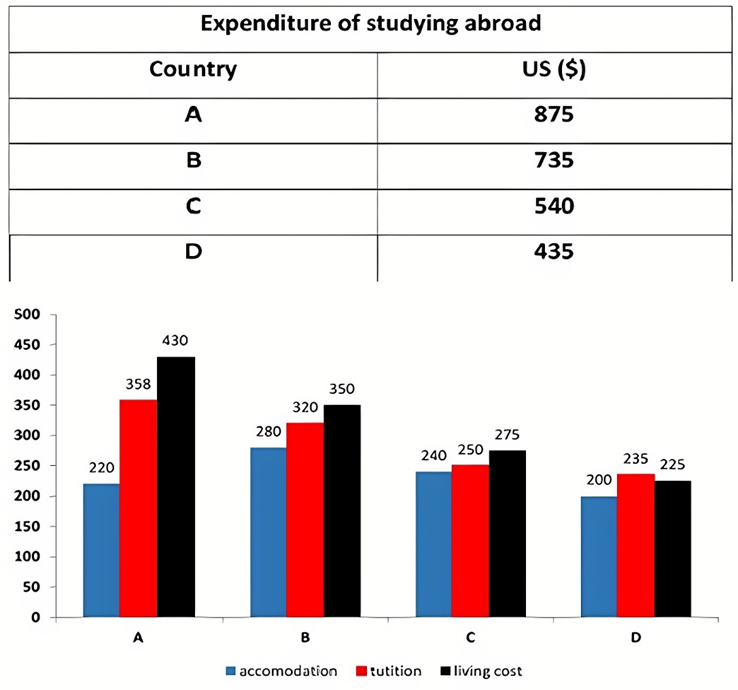
Student spending abroad

The table and chart provide a breakdown of the total expenditure and the average amount of money spent by students per week while studying abroad in four countries. Summarise the information by selecting and reporting the main features, and make comparisons where relevant.

2.455 lượt làm20 phút
Task 1Table

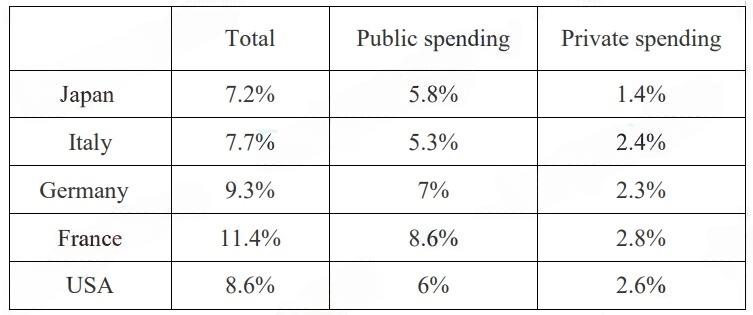
Spending on health

The table below shows information about spending on health in five different countries in 2002.

8.669 lượt làm20 phút
Trang 1/3